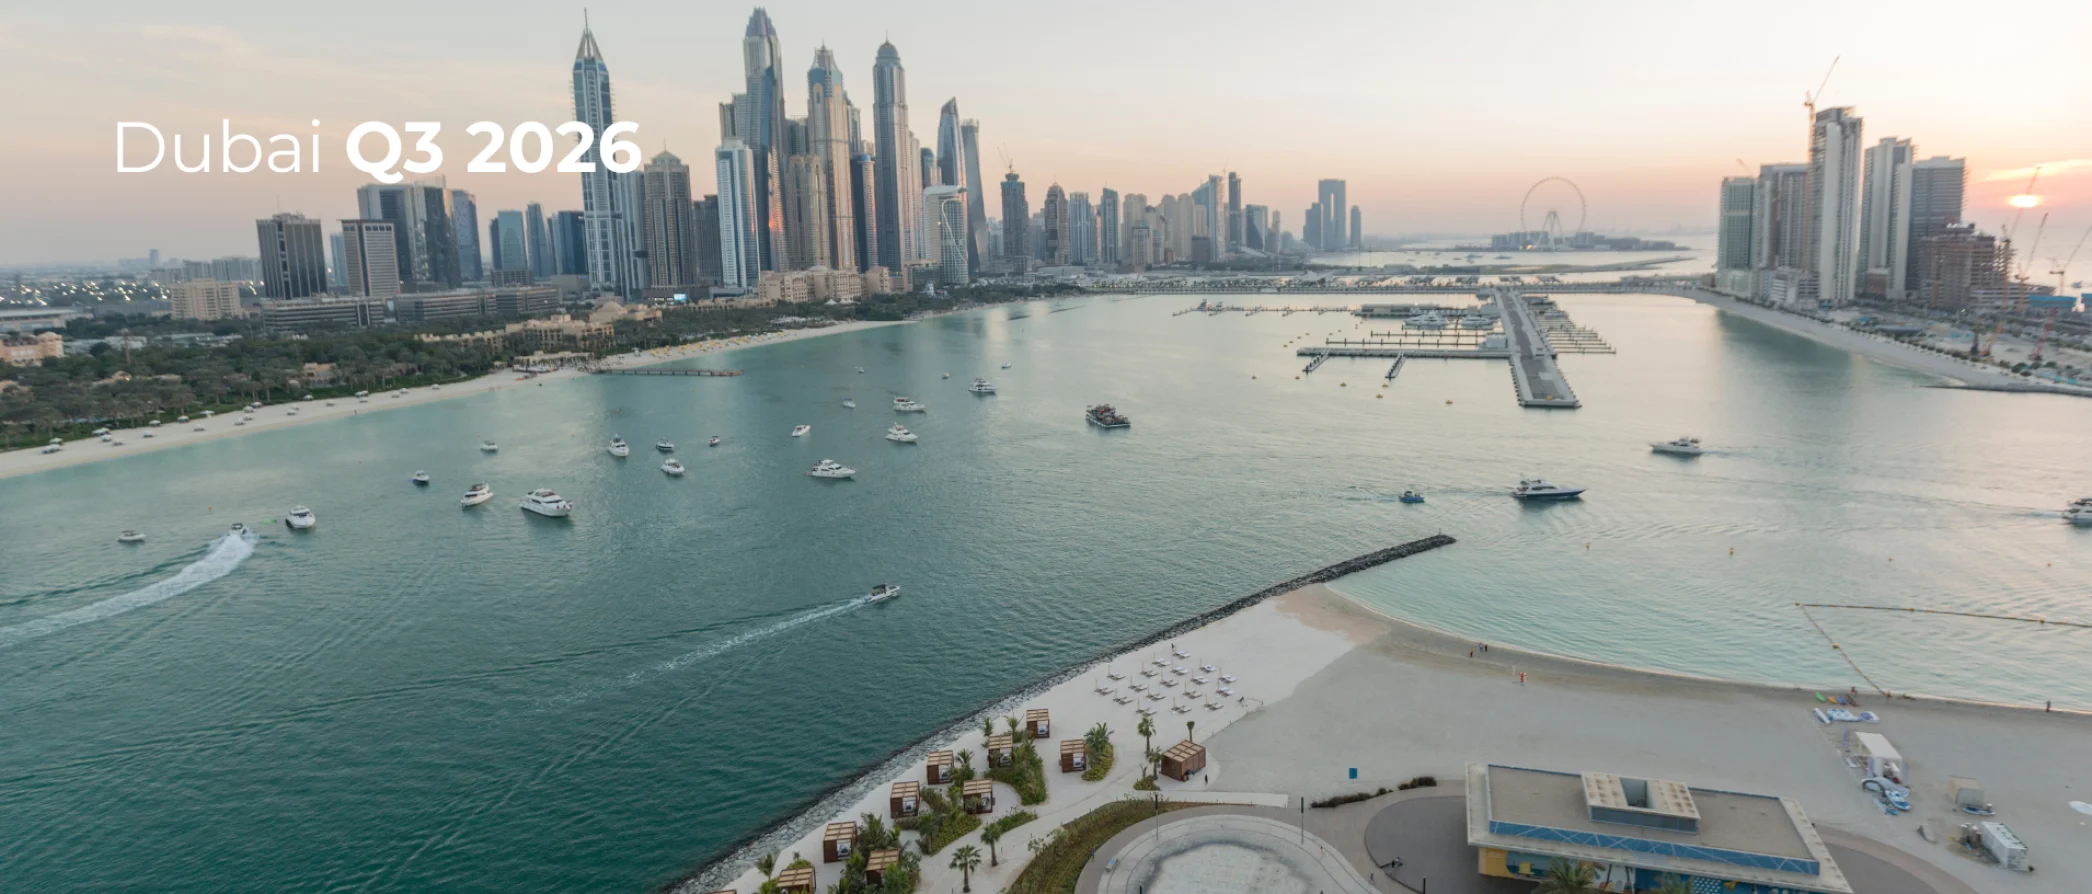
The third quarter of 2026 covers the period from July to September 2026. Dubai recorded 29,912 property sales across all property types, with a total value of AED 73.07 billion. The median price per square foot (sqft) came to AED 1,680, or roughly AED 18,100 per square metre.
Indicator | Q3 2026 | Q3 2025 | Change |
|---|---|---|---|
Number of sales | 29,912 | 59,340 | -49.6% |
Value of sales | AED 73.07 billion | AED 170.63 billion | -57.2% |
Median price per sqft | AED 1,680 | AED 1,701 | -1.2% |
Year on year, there were therefore far fewer transactions and a much lower total value, while the median price per sqft changed by only 1.2%. In practical terms, people bought far less, but the price at which deals were closed stayed almost the same. The median, however, does not show how the price of the same property changed, because the mix of what is sold also changes from quarter to quarter.
Month | Number of sales | Value of sales | Median price per sqft |
|---|---|---|---|
July 2026 | 14,144 | AED 34.91 billion | AED 1,682 |
August 2026 | 12,018 | AED 28.61 billion | AED 1,681 |
September 2026 | 11,340 | AED 29.73 billion | AED 1,656 |
The number of sales declined steadily over the quarter, from 14,144 in July to 11,340 in September. Value was lowest in August and rose slightly in September, while the median price per sqft stayed within a narrow range of AED 1,656 to AED 1,682. This means trading activity was strongest at the start of summer and gradually faded, while prices remained stable.
To read the figures correctly, it is important to know what they are compared with. The third quarter of 2025 was the strongest third quarter in the history of the Dubai market and was among the strongest periods the market has ever seen. The year-on-year drop of just under half in the number of sales therefore partly reflects how high the bar had been set.
At the same time, it must be said openly that the decline is real and visible. The slowdown follows the regional uncertainty that has been affecting buyers' decisions since February 2026. The data, however, do not show a sudden collapse in prices. The number of transactions and their total value fell, while the median price per sqft remained almost unchanged. Such a development can be described as a gradual cooling of the market after a record period. The monthly figures also show a gradual rather than abrupt slowdown.
Put simply, after a period of very fast growth the market has slowed down. Buyers are more cautious and more selective, but the prices of actually completed deals have so far not moved significantly. With property, the number of transactions usually changes first and the price may show the change only later, which is why it is useful to follow the next quarter as well before drawing a trend from a single period.
Where trading takes place is often more interesting than the overall figure. The two rankings below show the five most active areas by value and by number of sales. They include apartments, villas and commercial property, but not townhouses, plots and buildings, so they are not directly comparable with the overall figures above. The total of 29,912 sales covers all property types, while the rankings cover only these three, so they cannot be used to calculate an area's share of all sales. They serve to compare the areas with one another.
Rank | Area | Value of sales |
|---|---|---|
1 | Dubai South | AED 5.31 billion |
2 | Business Bay | AED 3.51 billion |
3 | Palm Jumeirah | AED 2.42 billion |
4 | Marsa Dubai | AED 2.32 billion |
5 | Al Barsha South Fourth | AED 2.21 billion |
By value, Dubai South leads by a clear margin, with a volume roughly half as high again as the second-placed area, Business Bay. In other words, this is where the most money changed hands in sales. We also see that the five areas with the highest sales value include established premium addresses such as Palm Jumeirah and Marsa Dubai, even in a period when the market is slowing.
Rank | Area | Number of sales |
|---|---|---|
1 | Dubai South | 4,662 |
2 | Al Barsha South Fourth | 1,966 |
3 | Wadi Al Safa 4 | 1,719 |
4 | Jebel Ali | 1,371 |
5 | Wadi Al Safa 3 | 1,194 |
Dubai South also leads by number of sales, with more than twice as many as the second-placed area. Only two areas, Dubai South and Al Barsha South Fourth, appear in both rankings. According to our calculation, each averages roughly AED 1.1 million per transaction, close to the median apartment price across Dubai (just under AED 1.03 million). It follows that most deals take place in the ordinary mid-price segment, not only among the most expensive properties.
Areas such as Business Bay, Palm Jumeirah and Marsa Dubai did not make the top five by number of sales, yet they are in the top five by value. That means fewer deals, but of higher value. Conversely, Wadi Al Safa 4, Jebel Ali and Wadi Al Safa 3 appear only by number of sales. Number and value therefore do not necessarily move together, and it is worth following both to get a picture of the market.
In the third quarter of 2026, almost 97,000 rental contracts were recorded in the apartment, commercial and villa categories.
Type | New contracts | Median rent, new contracts (AED/year) | Renewals | Median rent, renewals (AED/year) |
|---|---|---|---|---|
Apartments | 37,715 | 68,000 | 37,929 | 59,000 |
Commercial premises | 5,320 | 115,000 | 5,938 | 115,500 |
Villas | 5,366 | 175,000 | 4,390 | 170,000 |
New contracts and renewals are two separate groups of contracts. The difference between the medians for apartments (AED 68,000 and AED 59,000) therefore does not tell us how much the rent rose for any individual tenant. For villas and commercial premises, the medians of the two groups are very close.
In practice, for apartments there is roughly one renewal for each new contract. A large share of tenants therefore stays in their homes, while a comparable number of new contracts is signed at the same time. The rental market is lively in the third quarter.
Volume fell, but prices have barely moved so far. The number and value of sales are significantly lower after a record year, while the median price per sqft changed by only 1.2% year on year.
The slowdown is visible, and the coming quarters will show how it develops. The exact size of the decline may differ depending on which property types and which registration period are counted in the statistics. The next quarter will show whether activity stabilises.
Trading is concentrated in a few areas. Dubai South leads both by value and by number of sales.
The rental market remains active. Contract renewals and new contracts are roughly balanced for apartments.
Are you considering a specific location and want to know how it performed in Q3 2026? We will gladly go through the data with you and discuss your situation.
Source: DXBinteract report for Q3 2026, Dubai Land Department (DLD) data.